

In the world of machine learning, building a model is only half the battle. The real challenge lies in evaluating how well that model performs—and that’s where performance metrics in machine learning come into play. Whether you’re predicting customer churn, detecting fraud, or recommending the next binge-worthy show, your model’s success hinges on how effectively it solves the intended problem. And to measure that success, we rely on a range of evaluation metrics.
But choosing the right metric isn't as straightforward as it might seem. A model with 95% accuracy might sound impressive—until you realize it’s classifying 95% of non-events correctly in an imbalanced dataset while missing all the actual events. That’s why understanding different performance measures in machine learning is not just important—it's essential.
In this guide, we’ll walk you through the most widely used performance metrics across various types of machine learning problems—classification, regression, clustering, and ranking. You’ll learn not just what these metrics are, but when and why to use them. Whether you're a beginner trying to decode your first confusion matrix or an experienced data scientist optimizing a multi-class model, this article will serve as your go-to reference for understanding model evaluation the right way.
Also Read: What is LLM? A Complete Guide to Large Language Models in AI and Generative AI
What Are Performance Metrics in Machine Learning?
Performance metrics are quantitative measures used to assess how well a model performs on a given task. They act as a scoreboard, helping us understand whether our model is making accurate predictions, whether it's generalizing well to new data, and whether it's suitable for real-world deployment.
These metrics provide insight into the strengths and weaknesses of a model, guiding us in tasks such as:
- Comparing different algorithms,
- Tuning hyperparameters,
- Detecting overfitting or underfitting,
- Making decisions about model deployment.
Different machine learning tasks require different types of performance measures. For instance:
- In a classification problem, we want to know how often the model predicts the correct class.
- In regression, we measure how close the predicted values are to the actual numerical outputs.
- In clustering, where labels are often unknown, we need specialized metrics to assess how well the model grouped similar data points.
- In ranking or recommendation systems, we evaluate how well the model orders items based on relevance.
It's important to note that there is no one-size-fits-all metric. The right metric depends heavily on the specific problem you're trying to solve, the nature of the data, and the business or research goals.
In the following sections, we’ll explore these performance metrics by category, breaking down what they mean, how to calculate them, and when they’re most useful.
Performance Metrics for Classification Models
Classification is one of the most common tasks in machine learning, where the goal is to assign inputs into predefined categories or classes (e.g., spam vs. not spam, disease vs. no disease). To evaluate the effectiveness of classification models, several performance metrics are used. Each metric offers a different perspective on how well the model is performing.
Accuracy
- Definition: The ratio of correctly predicted observations to the total observations.
- Formula:

Use Case: Works well when classes are balanced.
- Limitation: Misleading when the dataset is imbalanced. For instance, 95% accuracy in a dataset where 95% belong to one class may mean the model is just predicting the majority class.
Precision
- Definition: The ratio of correctly predicted positive observations to the total predicted positives.
- Formula:

- Use Case: Useful when the cost of false positives is high (e.g., spam detection).
Recall (Sensitivity or True Positive Rate)
- Definition: The ratio of correctly predicted positive observations to all actual positives.
- Formula:

- Use Case: Important in scenarios where missing positive cases is costly (e.g., cancer detection).
F1 Score
- Definition: The harmonic mean of precision and recall, providing a balance between them.
- Formula:

Use Case: Ideal when you need a balance between precision and recall and the data is imbalanced.
Also Read: How Computer Vision Is Transforming Industries: Examples from Healthcare to Retail
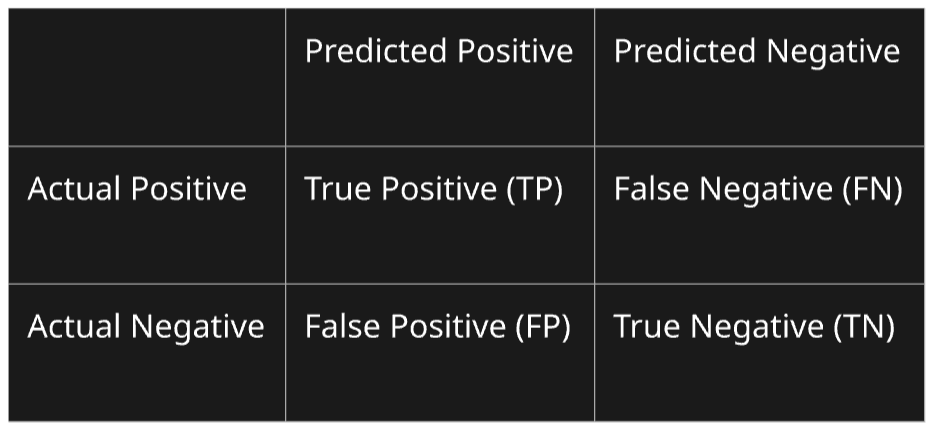
Confusion Matrix
- Definition: A table that shows the counts of true positive (TP), false positive (FP), true negative (TN), and false negative (FN) predictions.
- Purpose: Helps visualize model performance and identify misclassification patterns.
ROC Curve and AUC (Area Under the Curve)
- ROC Curve: Plots the True Positive Rate (Recall) against the False Positive Rate.
- AUC: Measures the area under the ROC curve. A higher AUC indicates a better model.
- Use Case: Helpful for comparing classifiers, especially in imbalanced datasets.
Matthews Correlation Coefficient (MCC)
- Definition: A more reliable metric than accuracy for binary classification, especially on imbalanced datasets.
- Formula:
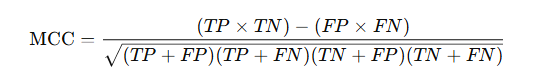
- Use Case: Used when you want a balanced evaluation, even with class imbalance.
These metrics help you understand different aspects of your model's behavior. In real-world projects, it's often wise to track multiple metrics to get a comprehensive view of performance.
Performance Metrics for Regression Models
In regression problems, the goal is to predict a continuous value (like price, temperature, or sales). Unlike classification, where we care about discrete labels, here we focus on how close the predicted values are to the actual ones. Below are the key performance measures for regression tasks:
Mean Absolute Error (MAE)
- Definition: The average of the absolute differences between predicted and actual values.
- Formula:
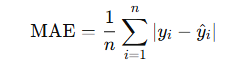
- Use Case: Simple to understand; useful when all errors are equally important.
Mean Squared Error (MSE)
- Definition: The average of the squared differences between predicted and actual values.
- Formula:
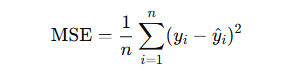
Use Case: Penalizes larger errors more than smaller ones. Sensitive to outliers.
Root Mean Squared Error (RMSE)
- Definition: The square root of MSE; brings error back to original units.
- Formula:

Use Case: Commonly used; gives more weight to large errors.
R-squared (Coefficient of Determination)
- Definition: Represents the proportion of the variance in the dependent variable that is predictable from the independent variables.
- Formula:
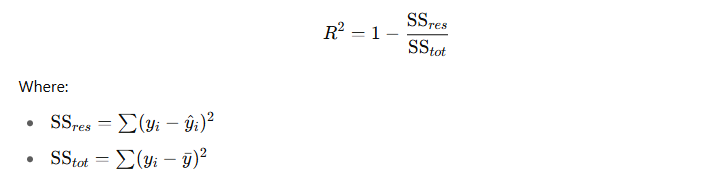
- Use Case: Indicates how well the model explains variability; ranges from 0 to 1.
Adjusted R-squared
- Definition: Modified version of R² that adjusts for the number of predictors in the model.
- Formula:
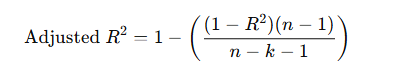
Where n is the number of data points, and k is the number of independent variables.
- Use Case: Useful when comparing models with different numbers of predictors.
Mean Absolute Percentage Error (MAPE)
- Definition: Measures prediction accuracy as a percentage.
- Formula:

- Use Case: Interpretable as a percentage error; less useful when actual values are near zero.
Each of these metrics highlights different aspects of regression model performance. For example, if your business cannot tolerate large deviations, RMSE might be more appropriate. But if interpretability is key, MAE or MAPE may be preferred.
Also Read: Everything You Need To Know About Optimizers in Deep Learning
Performance Metrics for Clustering Models
Clustering is an unsupervised learning task where the goal is to group similar data points together without pre-labeled outputs. Since we don’t have ground truth labels (most of the time), evaluating clustering models requires different performance measures —some based on external information (if available) and others purely internal.
Let’s explore the commonly used metrics in clustering:
Silhouette Score
- Definition: Measures how similar a data point is to its own cluster (cohesion) compared to other clusters (separation).
- Range: -1 to 1
- A score close to 1: well-clustered
- A score close to 0: overlapping clusters
- A score below 0: probably misclassified
- A score close to 1: well-clustered
- Use Case: Ideal for determining the optimal number of clusters.
Davies-Bouldin Index
- Definition: Measures the average similarity between each cluster and its most similar one, based on intra-cluster and inter-cluster distances.
- Interpretation: Lower values indicate better clustering.
- Use Case: Used to compare clustering algorithms or tune the number of clusters.
Calinski-Harabasz Index (Variance Ratio Criterion)
- Definition: The ratio of between-cluster dispersion to within-cluster dispersion.
- Interpretation: Higher values indicate well-separated clusters.
- Use Case: Commonly used to evaluate clustering quality in k-means.
Dunn Index
- Definition: Ratio of the minimum inter-cluster distance to the maximum intra-cluster distance.
- Interpretation: Higher values mean better clustering.
- Use Case: Helps assess the compactness and separation of clusters.
Adjusted Rand Index (ARI) – External Metric
- Definition: Compares the similarity between predicted clusters and ground truth class labels, adjusted for chance.
- Range: -1 (no agreement) to 1 (perfect match).
- Use Case: Useful when true labels are available for evaluation.
Normalized Mutual Information (NMI) –
- Definition: Measures the amount of shared information between the predicted clusters and actual classes.
- Range: 0 (no mutual information) to 1 (perfect match).
- Use Case: Appropriate when ground truth labels exist, like in benchmarking clustering performance.
These performance metrics help quantify how meaningful and distinct your clusters are, even when you don’t have labels to compare against. A combination of internal and external metrics (when possible) gives a comprehensive view of clustering effectiveness.
Choosing the Right Performance Metric
With so many performance metrics, choosing the right one can feel overwhelming—but it's crucial for model success. The ideal metric depends on your specific problem, data characteristics, and business goals.
Here’s a simple guide to help:
Classification Tasks
- Imbalanced Classes? Use Precision, Recall, F1-Score, or ROC-AUC.
- Multi-Class? Use Macro/Micro F1-Score or Confusion Matrix.
- Top-k Classes Important? Consider Top-K Accuracy or Log Loss.
Regression Tasks
- Want to minimize large errors? Use RMSE or MSE.
- Need interpretability? Go for MAE or MAPE.
- Explaining Variance? Use R² or Adjusted R².
Clustering Tasks
- No ground truth? Use internal metrics like Silhouette Score, DB Index.
- With labels? Use Adjusted Rand Index or Normalized Mutual Information.
Also Read: What is Gradient Descent in Deep Learning? A Beginner-Friendly Guide
Always consider the business context. For example, in fraud detection, missing a fraud (false negative) is worse than a false alarm (false positive), so Recall is more important. Use multiple metrics. Don’t rely on one metric alone—combine them for a balanced view. Visualizations help. Confusion matrices, ROC curves, and error plots often reveal insights beyond numbers.
Performance metrics aren't just numbers—they're decision-making tools. The right metric helps you build smarter, fairer, and more useful models. As you evolve your ML skills, choosing and interpreting these metrics wisely will set you apart from the crowd.
Conclusion
Understanding and applying the right performance metrics in machine learning is as critical as building the model itself. These evaluation metrics serve as a compass—guiding data scientists and engineers toward better decisions, more accurate models, and real-world impact. Whether you're solving classification, regression, clustering, or recommendation problems, the right performance measures in machine learning ensure that your model isn’t just technically sound but also practically valuable.
As you continue your machine learning journey, remember: the success of your model isn't defined by accuracy alone—it's defined by choosing the metric that aligns with your problem, your data, and your goals.
Ready to transform your AI career? Join our expert-led courses at SkillCamper today and start your journey to success. Sign up now to gain in-demand skills from industry professionals. If you're a beginner, take the first step toward mastering Python! Check out this Full Stack Computer Vision Career Path- Beginner to get started with the basics and advance to complex topics at your own pace.
To stay updated with latest trends and technologies, to prepare specifically for interviews, make sure to read our detailed blogs:
How to Become a Data Analyst: A Step-by-Step Guide
How Business Intelligence Can Transform Your Business Operations
.jpeg)


.avif)
