

Introduction
DAX (short for Data Analysis Expressions) is the language that makes your data in PowerBI, Power Pivot and other tools. Think of it as a set of powerful formulas you can use to create your own custom calculations, like finding total sales, profit margins, or even comparing year-to-date performance.
Why is DAX important? Well, it helps you go beyond the basics. Instead of just looking at rows of boring raw data, you can turn those numbers into meaningful insights that actually matter to your goals. Whether you’re building a sales report or tracking business trends over time, DAX helps you ask deeper questions and get clearer answers.
Sounds useful, right? The best part is, you don’t need to be a math wizard to get started. With a little know-how and some practice, DAX can take your data game to the next level. By the end of this article, you’ll have a solid grasp of what DAX is, how it works, and how to start using it to create some pretty impressive custom calculations. Let’s jump in!
Quick Links:
The Importance of Context (Row Context vs Filter Context)
Key Concepts
Alright, so now that we’ve got the intro out of the way, it’s time to dig into the core ideas behind DAX. Don’t worry, this won’t be a deep-dive into scary math stuff—it’s more like learning the simple building blocks that you’ll use to create magic with your data. Below, we’ll break down the key concepts, so grab a cup of coffee (or tea) and let’s go!
Measures
Think of measures as little custom calculators that perform dynamic math for you. They don’t live inside your data tables—instead, they float around in your reports and only come to life when you use them. Confused? Here’s an example:
Imagine you want to calculate total sales. Instead of manually adding numbers for every single row, you can create a measure in DAX with a formula like SUM(Sales[Amount]), and—Bam!—the measure will instantly calculate the total for you, whether it’s for a single month, a year, or your entire dataset.
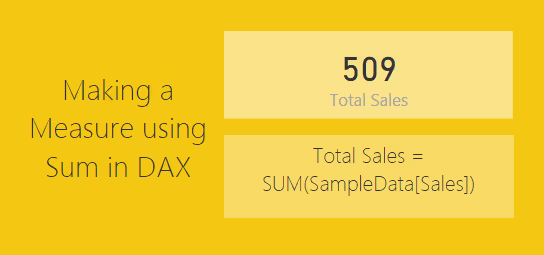
The cool part? Measures automatically adjust to filters in your reports. If you’re looking at March 2023 sales only, the measure will recalculate for that timeframe. Handy, right?
Calculated Columns
Calculated columns, live inside your data tables and do math or logic on every single row. Think of them as adding new "mini-columns" to your dataset.
Here’s an easy example:
You’ve got a table with “Sales” and “Costs,” but you don’t have a column for profit. Simply create one with a formula like [Sales Value] – [Cost of Sales], and voila! A new column called “Profit” appears, showing you the profit for each row.
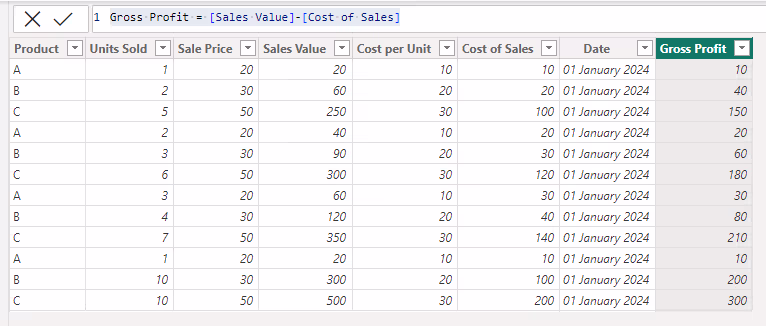
Just remember, calculated columns are fixed—they don’t dynamically change with filters like measures do.
Calculated Tables
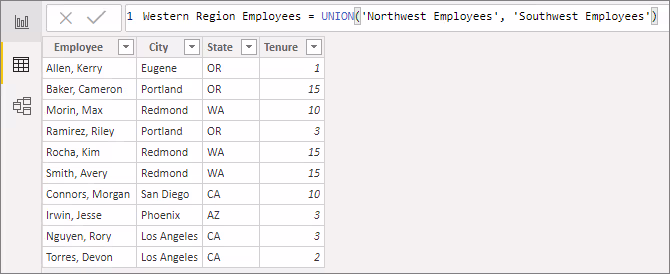
Calculated tables are like creating a fresh, new table out of your existing data—with a little help from DAX formulas. Think of it as combining or reshaping data to get exactly what you need, without messing up the original tables.
Here’s a simple scenario to show you how it works:
Imagine you have two employee tables in your dataset—one for Northwest Employees and one for Southwest Employees. But now, you want a combined table for the entire Western region. Instead of manually merging these tables, DAX makes it super easy with the UNION function.
Using a formula like this:

You’ll get a brand-new calculated table that combines both employee lists into one. This new table, named "Western Region Employees," will have all the rows from Northwest Employees and Southwest Employees in a single view.
With calculated tables, you can do things like summarize data, merge information, or create entirely new datasets to make your analysis more organized and powerful. It’s like your personal data organizer in DAX form!
The Importance of Context (Row Context vs Filter Context)
Ah, context—the secret sauce of DAX. Understanding this is what takes your DAX skills from good to great! Every time you write a formula in DAX, it behaves differently based on the context of the data. There are two major types to know:
- Row Context is all about individual rows. When you use calculated columns, DAX looks at each row one at a time. For example, the formula Sales[Amount] - Sales[Cost] works row by row to calculate the profit for each entry.
- Filter Context comes into play when you slice, dice, or filter data in your visuals or reports. For instance, when you look at sales for March 2023, the measure using SUM(Sales[Amount]) recalculates based on that filter, showing only the total for March instead of everything.
If row context is about “zooming into” a single row, filter context is about “zooming out” to view the bigger picture. Together, they make DAX flexible and oh-so-powerful!
DAX Functions
DAX functions are like the toolbox for your data—you use them to build calculations, pull insights, and make sense of all those numbers and columns. But, don’t worry if it all sounds overwhelming. At its heart, DAX just gives you a way to write instructions for analysing your data. Once you get the hang of it, you’ll find these functions to be powerful helpers!
DAX functions fall into different categories, and each type is like its own special tool. Here’s a breakdown of the most useful ones:
- Aggregation Functions
- These are your basics—functions like SUM, AVERAGE, MIN, MAX, and COUNT.
- They help you calculate totals, averages, smallest/largest values, and counts for data in a single column. For example, SUM(Sales[Amount]) totals up all sales amounts in the Sales table.
- Logical Functions
- Logical functions, like IF or SWITCH, test conditions and give results based on whether something is true or false.
- Example: If you want to mark sales above $10,000 as “High” and the rest as “Low,” you’d use a formula like IF(Sales[Amount] > 10000, "High", "Low").
- Text Functions
- These handle text values, helping you combine or manipulate strings.
- Example functions include CONCATENATE (combines two text strings) or SEARCH (finds a specific word within text).
- Time Intelligence Functions
- These are great for analysing time-based data, like trends over weeks, months, or years.
- Example functions include TOTALYTD (year-to-date totals) and DATEADD (shifting dates forward or backward). These functions make it easy to compare sales last year versus this year.
- Filter Functions
- Filter functions, like CALCULATE or FILTER, change what data gets included in a calculation.
- Example: If you want total sales, but only for a specific product, you can add a filter like CALCULATE(SUM(Sales[Amount]), Sales[Product] = "Laptop").
- Other Specialized Functions
- There are also functions for managing relationships between tables (RELATED and LOOKUPVALUE), creating ranking systems (RANKX), and even math or statistical calculations (STDEV.P, ROUND).
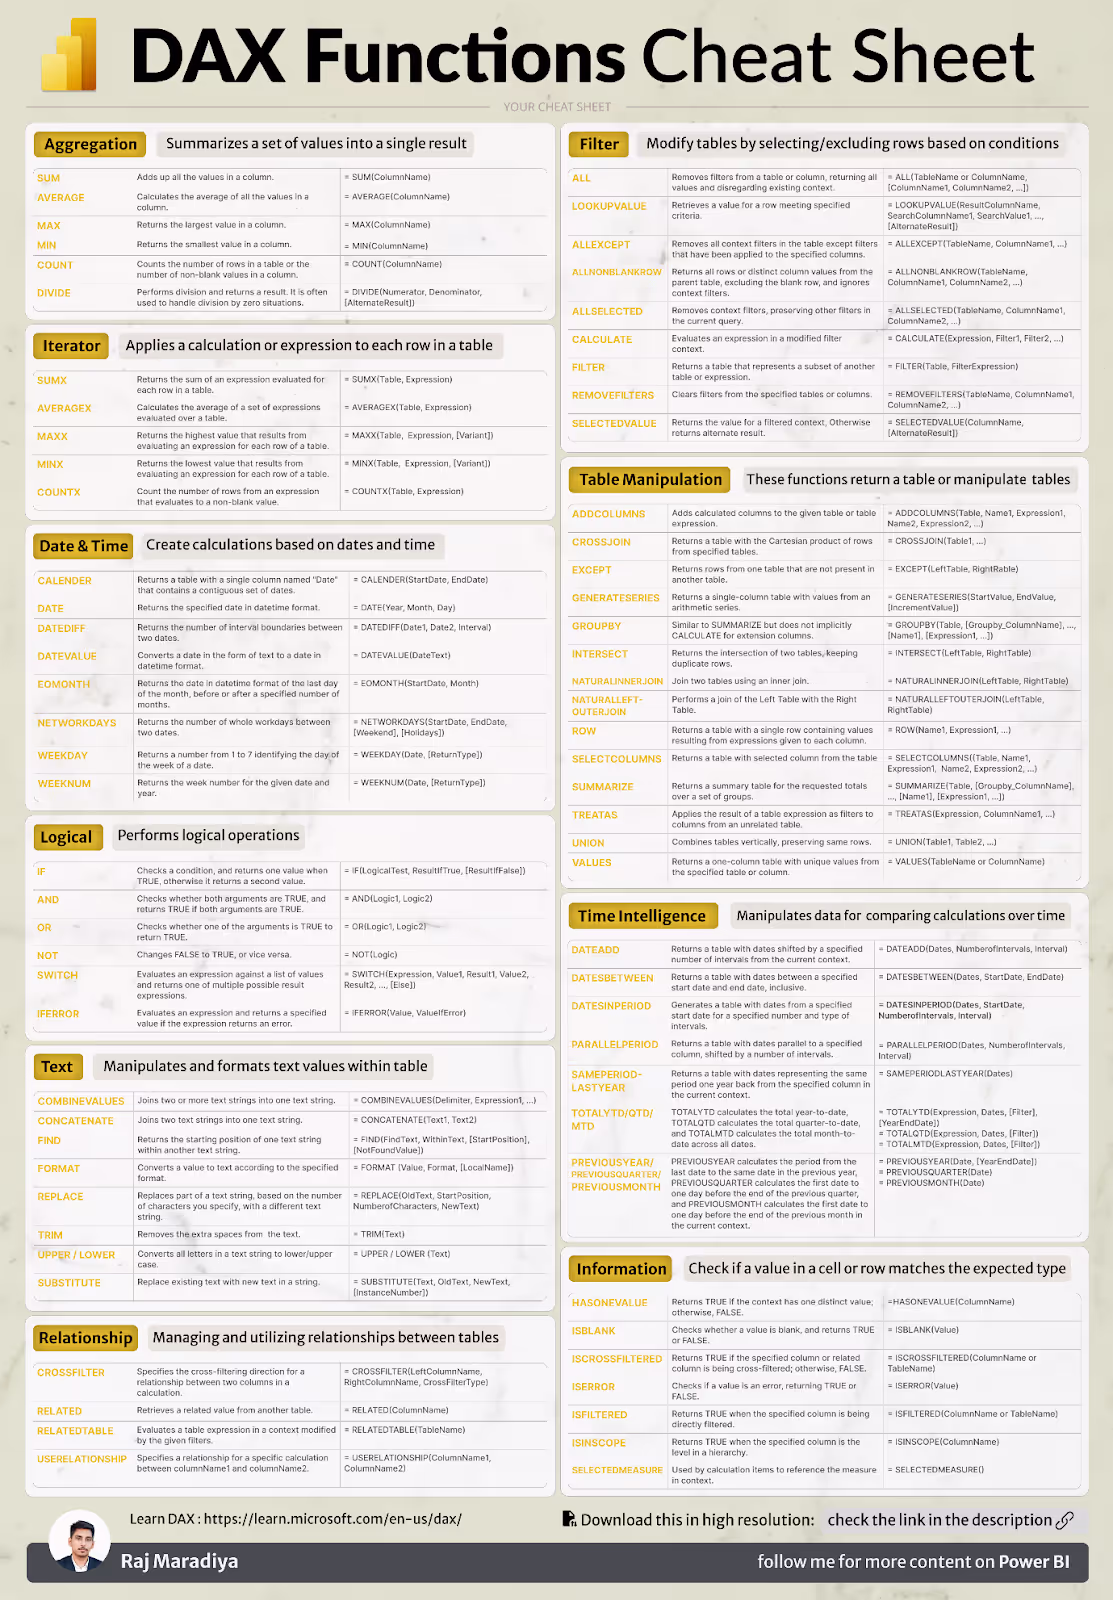
Here’s a handy cheat sheet, courtesy of Raj Maradiya.
How They Work Together
The real magic happens when you combine these functions. For example, you can use an aggregation function like SUM within a filter function like CALCULATE to get totals for specific scenarios. Add some time intelligence to the mix, and suddenly, you’re comparing month-to-month performance dynamically.
DAX Best Practices
Working with DAX (Data Analysis Expressions) in Power BI can feel a little like learning a new language. And guess what? That’s okay—it’s not as tough as it sounds. Whether you’re a beginner or brushing up your skills, following these best practices will help you write DAX expressions that are clean, efficient, and easy to understand.
Here’s how you can make your DAX magic in Power BI truly shine.
Make Your Formulas a Joy to Read
- Use descriptive names for measures, calculated columns and variables.
- Format your code nicely. Use line breaks and indentations. Would you read a 500-word paragraph in one chunk? No, right? Your DAX shouldn’t feel like that either.
- Leave Breadcrumbs (a.k.a. comments): Add notes to explain what your formula’s doing, especially if it’s complicated. Trust me, future-you will thank past-you.
Measures Are Your Best Friends
Here’s a solid rule of thumb—use measures instead of calculated columns whenever you can.
- Why?
Measures run on the spot, keeping your data model lean and mean. Calculated columns, on the other hand, take up precious space in memory. - When to Use Calculated Columns:
If you need a result for filtering or grouping, calculated columns are necessary. Otherwise, stick to measures!
Play Smart With Variables
Variables simplify your formulas, making them easier to read and faster to calculate.
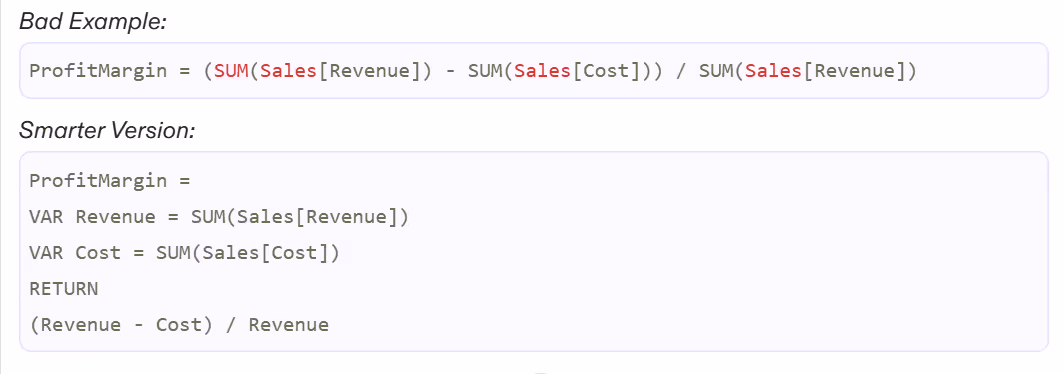
By breaking things down into smaller chunks, you can troubleshoot and adjust your formulas easily whenever needed.
Bonus Tip: You can even test your variables step by step!
Don’t Sacrifice Speed (Optimize Your DAX)
Nobody likes a slow dashboard, right? Here’s how to keep things snappy:
- Skip the Fancy Loops Unless Necessary
Functions like SUMX or FILTER are powerful but can slow things down if overused. Whenever possible, use simpler aggregations like SUM, AVERAGE, or COUNT. - Pre-Process Heavy Lifting
Do the complex stuff in Power Query or your data source before bringing it into DAX. Your formulas will thank you.
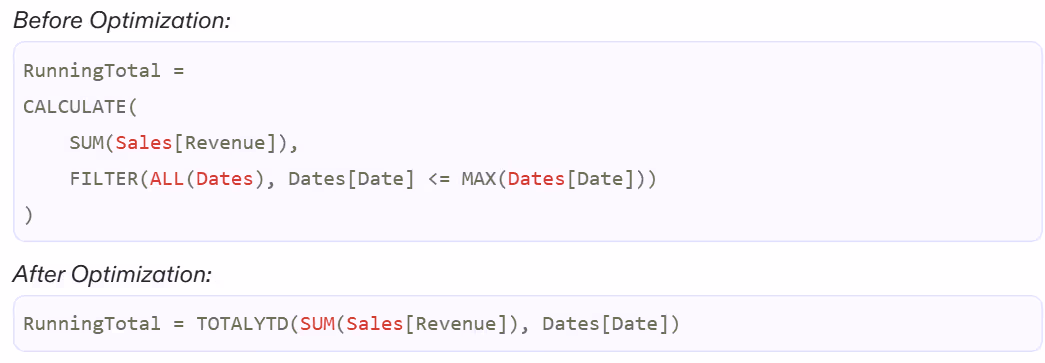
Take Advantage of Built-In Functions
Power BI gives you amazing convenience, so why reinvent the wheel? Use the built-in time intelligence functions to keep life simple.

KISS (Keep it Simple, Stupid)
Don’t try to flex with the most complex DAX formula you can write. The best DAX is clean, simple, and just does the job.
Stick to:
- Descriptive variable names
- Built-in time intelligence functions
- Clean, reusable measures
If your formula feels like rocket science, it might be time to revisit simplicity.
Learn and Level up Constantly
DAX is a skill you build over time. Stay curious and keep learning!
- Explore Free Resources like DAX Guide or Power BI forums.
- Use Sample Datasets to practice different scenarios.
- Take Courses tailored to Power BI and DAX, like the ones on skillcamper.com.
Each step you take strengthens your DAX brainpower—and makes you the go-to expert in your team!
Wrapping It Up
DAX in Power BI is the driving force that helps you explore deeper insights and create dynamic, insightful reports. Whether you’re working on calculated measures, analysing complex data relationships, or tapping into time intelligence features, Data Analysis Expressions give you the tools to take your analysis to the next level.
At first, learning DAX Basics can feel like a challenge. But with consistent practice and a strong grasp of the key concepts, it quickly becomes a powerful skillset. Start small by trying out basic functions like SUM and CALCULATE. These foundational tools will build your confidence as you progress toward handling more advanced topics such as context manipulation and variables.
One of the best ways to enhance your understanding of Data Analysis Expressions is to apply them to real-world scenarios. Keep experimenting and practicing, and don’t be afraid to stay curious! For a more structured approach, you can also explore a Power BI DAX tutorial or check out SkillCamper’s beginner-friendly Power BI courses. These resources provide expert guidance and hands-on learning to help you grow.
Every DAX formula you build brings you one step closer to becoming a confident Power BI user. Your data mastery adventure is just beginning, so keep pushing forward—you’re on your way to turning raw data into actionable insights!


.jpeg)


.avif)
