

Understanding statistical distributions is crucial for making sense of data in machine learning and AI. From predicting probabilities to optimizing models, distributions like Normal, Poisson, Binomial, and Exponential play a key role in data analysis.Understanding distribution statistics is essential for analyzing data patterns, making predictions, and optimizing machine learning models. In this blog, we’ll explore the types of statistical distributions, their significance, and how they impact AI applications.
What is a Statistical Distribution?
A statistical distribution describes how values of a random variable are distributed. It tells us the probability of different outcomes occurring in a dataset. In simple terms, it helps us understand:
- How often a particular value appears.
- What patterns exist in the data.
- How we can make predictions based on past data.
Understanding all distribution in statistics is crucial for selecting the right probability model in machine learning, data analysis, and real-world problem-solving.
Why Are Distributions Important in Machine Learning and AI?
Machine learning models work with data, and real-world data follows certain distributions. Knowing the underlying distribution helps in:
- Choosing the right machine learning algorithm.
- Understanding data trends and patterns.
- Improving model performance by using correct assumptions.
- Reducing overfitting and underfitting issues.
For example:
- In classification problems, we often deal with discrete distributions (e.g., Bernoulli, Binomial).
- In regression problems, we deal with continuous distributions (e.g., Normal, Exponential).
Types of Statistical Distributions
Statistical distributions are broadly classified into two types:
- Discrete Distributions (for countable outcomes)
- Examples: Bernoulli, Binomial, Poisson
- Used in classification, event modeling, and NLP.
- Continuous Distributions (for real-valued data)
- Examples: Normal, Uniform, Exponential, Gamma
- Used in regression, anomaly detection, and probability estimation.
Also Read: A Beginner's Guide to Linear Regression: Understanding the Fundamentals
Discrete Distributions
Discrete distributions deal with countable, finite outcomes. These are used when data is in the form of whole numbers (e.g., number of defective items, number of clicks on an ad, number of arrivals at a store).
They are widely used in classification, probability estimation, and event modeling.
Bernoulli Distribution
What is Bernoulli Distribution?
The Bernoulli distribution is the simplest discrete distribution. It models a situation where there are only two possible outcomes:
Success (1) → Event occurs (e.g., getting heads in a coin toss).
Failure (0) → Event does not occur (e.g., getting tails in a coin toss).
Formula:

Example:
- Tossing a fair coin:
Probability of heads (1) = 0.5
Probability of tails (0) = 0.5
- A spam filter in email classification:
1 = The email is spam
0 = The email is not spam
Application in Machine Learning & AI:
- Logistic Regression (Binary classification)
- Spam Detection (Spam vs. Not Spam)
- Customer Churn Prediction (Customer leaves or stays)
Python Example:

Binomial Distribution
What is Binomial Distribution?
The Binomial distribution is an extension of Bernoulli distribution. It models the number of successes in n independent trials of a Bernoulli event.
Formula:

Example:
- Coin Toss: Tossing a fair coin 10 times and counting how many times you get heads.
- Quality Control: Checking 10 light bulbs, where each has a 5% probability of being defective.
Application in Machine Learning & AI:
- A/B Testing (Checking how many users clicked an ad)
- Fraud Detection (Counting fraudulent transactions in a dataset)
Python Example:


Poisson Distribution
What is Poisson Distribution?
The Poisson distribution models the number of times an event occurs in a fixed time or space when the events happen at a constant rate.
Formula:

Example:
- Number of customers arriving per hour at a restaurant.
- Number of emails received per day in an inbox.
- Number of spelling mistakes in an essay.
Application in Machine Learning & AI:
- Anomaly Detection (Detecting unusual login attempts)
- NLP (Natural Language Processing) (Modeling word occurrences in text)
- Traffic Flow Analysis (Predicting the number of cars on a highway)
Python Example:

Summary of Discrete Distributions:

Also Read: Random Forest: Why Ensemble Learning Outperforms Individual Models
Continuous Distributions
Continuous distributions describe data that can take any real value within a range. Unlike discrete distributions (which deal with countable outcomes), continuous distributions model real-world measurements such as height, weight, temperature, time, and probability densities.
They are widely used in regression problems, probability estimation, anomaly detection, and deep learning.
Normal (Gaussian) Distribution
What is Normal Distribution?
The Normal distribution, also called the Gaussian distribution, is the most common probability distribution in statistics and machine learning. It represents real-world continuous data that tends to be symmetrically distributed around a mean (bell-shaped curve).
Formula:

Example:
- Height of people in a population
- IQ scores of students
- Stock market returns
Key Properties:
✔ Symmetric bell-shaped curve
✔ Mean = Median = Mode
✔ 68-95-99.7 Rule (68% of data lies within 1σ, 95% within 2σ, 99.7% within 3σ)
Application in Machine Learning & AI:
- Feature Scaling (Standardization assumes data follows a normal distribution)
- Anomaly Detection (Identifying outliers)
- Deep Learning & Neural Networks (Weight initialization often follows normal distribution)
Python Example:

Uniform Distribution
What is Uniform Distribution?
The Uniform distribution represents a situation where all values in a given range are equally likely to occur. It has a constant probability density.
Formula:

Example:
- Rolling a fair die (Each face has an equal probability of 1/6)
- Random number generation in computer programs
- Lottery draws
Application in Machine Learning & AI:
- Random Weight Initialization in deep learning
- Monte Carlo Simulation (Generating random samples)
- Hyperparameter Tuning (Random search methods)
Python Example:

Exponential Distribution
What is Exponential Distribution?
The Exponential distribution is used to model the time between events in a Poisson process. It describes waiting times for an event that happens at a constant rate.
Formula:

Example:
- Time between incoming calls at a customer support center
- Time until failure of an electronic device
- Waiting time for a bus at a station
Application in Machine Learning & AI:
- Failure Prediction (Predicting hardware failures)
- Survival Analysis (Modeling lifespan of medical patients)
- Queueing Theory (Optimizing customer service processes)
Python Example:


Gamma Distribution
What is Gamma Distribution?
The Gamma distribution is a generalization of the exponential distribution. It models waiting times when an event needs to occur multiple times before being counted.
Formula:

Example:
- Time until a customer makes k purchases
- Time until a system experiences k failures
Application in Machine Learning & AI:
- Bayesian Inference (Prior distributions)
- Neural Network Training (Dropout rates and weight initialization)
Python Example:

Summary of Continuous Distributions:

Now, let’s dive deep into some advanced statistical concepts that are important in understanding data distributions and their role in machine learning.
Also Read: The Role of Machine Learning Repositories in Providing Valuable Datasets for Machine Learning
Skewness and Kurtosis
What is Skewness?
Skewness measures the asymmetry of a probability distribution. It tells us whether data is symmetrically distributed or leans toward one side.
- Symmetric Distribution (Skewness = 0)
- The left and right sides of the distribution are mirror images.
- Example: A perfect normal distribution has zero skewness.
- Right-Skewed Distribution (Positive Skewness, Skew > 0)
- The tail on the right side is longer.
- Most values are concentrated on the left, but extreme values pull the tail rightward.
- Example: Income distribution, where most people earn low-to-average salaries, but a few have very high incomes.
- Left-Skewed Distribution (Negative Skewness, Skew < 0)
- The tail on the left side is longer.
- Most values are concentrated on the right, but extreme values pull the tail leftward.
- Example: Exam scores, where most students score high, but a few have very low scores.


Why is Skewness Important in ML?
- Many ML models assume normality (e.g., linear regression, logistic regression). If data is skewed, model performance drops.
- Highly skewed data may require transformation (e.g., log transformation, Box-Cox transformation) for better modeling.
What is Kurtosis?
Kurtosis measures the "tailedness" of a probability distribution. It tells us how much of the data is in the tails compared to a normal distribution.
- Mesokurtic (Kurtosis ≈ 3)
- A normal distribution has kurtosis around 3.
- Moderate tails, no extreme outliers.
- Leptokurtic (Kurtosis > 3, "Peaked")
- High peak, fatter tails → More extreme outliers.
- Example: Stock market crashes, where occasional huge losses exist.
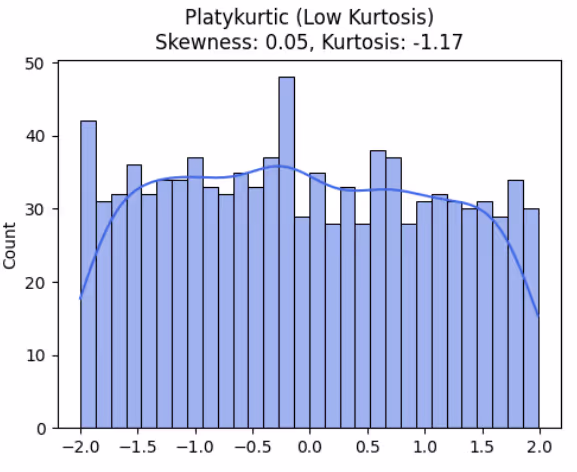
- Platykurtic (Kurtosis < 3, "Flat")
- Lower peak, thinner tails → Fewer extreme outliers.
- Example: Uniform distribution, where values are spread evenly.

Why is Kurtosis Important in ML?
- High kurtosis means more outliers, which can impact model accuracy.
- Detecting kurtosis helps in outlier detection and anomaly detection (e.g., in fraud detection systems).
Statistical distributions play a crucial role in machine learning, AI, and data science. Choosing the right distribution is essential for accurate modeling, prediction, and decision-making.
Also Read: Principal Component Analysis (PCA): Simplifying Data Without Losing Insights
How to Choose the Right Distribution?
To select an appropriate probability distribution, consider the following factors:
Type of Data
- Discrete Data (Counts, Categories) → Use Binomial, Poisson, Bernoulli
- Continuous Data (Measurements, Probabilities) → Use Normal, Exponential, Gamma
Shape of Data
- Symmetric, Bell-Shaped → Normal Distribution
- Skewed Right (Long Tail on the Right) → Exponential, Gamma
- Uniformly Spread → Uniform Distribution
Domain Knowledge
- In finance, stock returns often follow a normal distribution
- In queueing systems, customer waiting times follow an exponential distribution
- In predictive maintenance, failure rates follow a Poisson or Weibull distribution
Real-World Applications of Statistical Distributions in AI & ML

Importance of Understanding Distributions in Machine Learning
- Data Preprocessing & Feature Engineering
- Understanding distribution helps in normalizing, standardizing, or transforming data
- Example: If data is highly skewed, apply log transformation
- Model Selection & Optimization
- Some algorithms assume specific distributions (e.g., Naïve Bayes assumes normality)
- Choosing the wrong distribution affects performance
- Uncertainty Estimation & Probabilistic ML Models
- Bayesian models rely on prior and posterior distributions
- Understanding distributions improves probabilistic forecasting
- Anomaly & Fraud Detection
- Outlier detection relies on normality assumptions
- Gaussian Mixture Models (GMM) detect fraudulent activities
Mastering statistical distributions is crucial for data scientists, AI engineers, and machine learning practitioners. Each distribution has unique properties that help in data modeling, prediction, and decision-making.
By choosing the right distribution, we can improve model accuracy, handle real-world data better, and enhance AI applications.
✔ Statistical distributions describe how data is spread
✔ Discrete vs. Continuous Distributions depend on data type
✔ Normal, Poisson, Exponential, and Binomial distributions are commonly used in ML
✔ Understanding distributions improves feature engineering, model selection, and decision-making.
Conclusion
Statistical distributions are the foundation of probability and data science, playing a crucial role in understanding and modeling real-world phenomena. From discrete distributions like Bernoulli, Binomial, Poisson, and Geometric to continuous distributions like Normal, Exponential, Uniform, and Beta, each distribution provides valuable insights into different types of data behavior.
In distribution statistics, different probability distributions describe how data points are spread, helping in statistical inference and machine learning modeling.
In machine learning and data science, knowing all distribution in statistics helps in making accurate predictions, hypothesis testing, and understanding data variability. By understanding and visualizing these distributions, data scientists can select appropriate models, optimize algorithms, and make better data-driven decisions. Whether you're analyzing sales trends, predicting customer behavior, or building deep learning models, a strong grasp of probability distributions will enhance your AI expertise and make your machine learning models more interpretable and accurate.


.avif)


.avif)
