


In the world of machine learning, regression analysis plays a critical role in predicting outcomes based on input data. Among the various regression techniques, Linear Regression and Logistic Regression are the most widely used and often confused by beginners. While both methods aim to find relationships between dependent and independent variables, their purpose, application, and output type are fundamentally different.
Understanding the difference between linear and logistic regression is essential for anyone working with data modeling, predictive analysis, or machine learning algorithms. Choosing the wrong regression model for a given problem can lead to inaccurate predictions and misinterpretation of results. Hence, it becomes important to understand when to use Linear Regression and when to use Logistic Regression.
In this article, we will take a deep dive into Linear vs Logistic Regression, explore their key differences, and provide practical scenarios where each model should be used. Whether you are a data science beginner or a machine learning practitioner, this guide will give you a clear understanding of linear logistic regression and help you apply them effectively in real-world problems.
Also Read: A Deep Dive into the Types of ML Models and Their Strengths
What is Linear Regression?
Linear Regression is one of the most fundamental and widely used algorithms in supervised machine learning. It is primarily used to predict continuous numerical values based on the relationship between one or more independent variables (input) and a dependent variable (output). The primary goal of Linear Regression is to find the best-fit straight line (regression line) that minimizes the error between the predicted and actual values.
In simple words, Linear Regression is used when you want to predict a value like:
- Predicting house prices based on square feet area, number of rooms, and location.
- Predicting a person's salary based on years of experience.
- Predicting the temperature of a city based on historical data.
The output of a Linear Regression model is always a continuous value like price, temperature, age, or sales value.
Mathematical Equation of Linear Regression
The mathematical representation of Simple Linear Regression (with one input variable) is:

In Multiple Linear Regression (with multiple input variables), the equation becomes:

The model's objective is to minimize the error between the predicted value (y) and the actual value using a technique called Ordinary Least Squares (OLS).
Example of Linear Regression in Real Life
Example 1: Predicting House Prices
Suppose you want to predict the price of a house based on its area (in square feet). The input variable (area) is continuous, and the output variable (price) is also continuous.
- Input: Area (sq. ft.) = 1200
- Output: House Price = ₹25,00,000
The Linear Regression model will fit a straight line based on the training data and predict the house price based on new input values.
Example 2: Predicting Sales Revenue
Imagine you own a business and want to predict monthly revenue based on monthly advertising budget.
- Input: Advertising Budget = ₹50,000
- Output: Revenue = ₹3,00,000
The model will map the relationship between the advertising budget and revenue using a linear equation.
Graphical Representation of Linear Regression
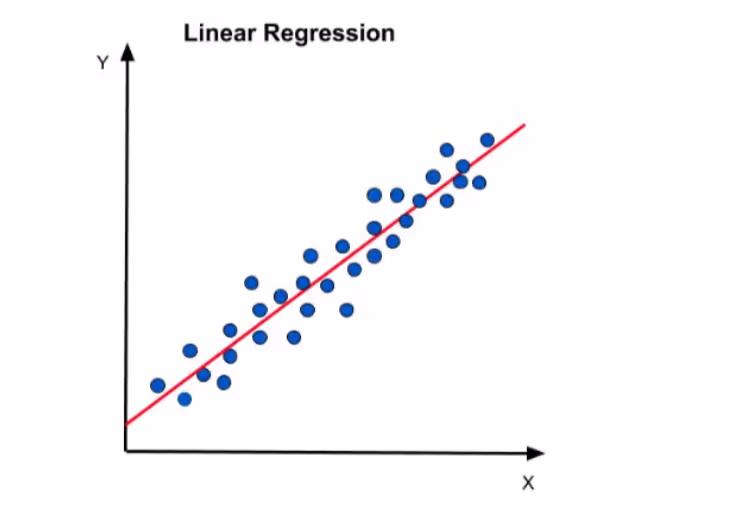
In Linear Regression, the relationship between input and output variables is represented using a straight line. This line is called the regression line, and it tries to minimize the distance between actual data points and the predicted values.
Here’s how it looks:
- X-axis: Independent Variable (like Area, Advertising Budget)
- Y-axis: Dependent Variable (like House Price, Sales Revenue)
- Straight Line: Best-fit line predicting the output
A perfect Linear Regression line means the predictions are very close to the actual values.
Key Characteristics of Linear Regression

Why Is It Called Linear Regression?
The term Linear Regression comes from the fact that the relationship between the input and output is represented as a straight line (linear) on a graph. The model tries to draw a straight line that best fits the data points to predict continuous numerical values.
Limitations of Linear Regression
Although Linear Regression is simple and easy to implement, it has some limitations:
- It cannot handle non-linear relationships between variables.
- Sensitive to outliers – extreme values can significantly impact predictions.
- Assumes a linear relationship even if the real-world data is not linear.
To learn more about linear regression checkout the article on A Beginner's Guide to Linear Regression: Understanding the Fundamentals
What is Logistic Regression?
Logistic Regression is a supervised machine learning algorithm used for classification problems, where the output variable is categorical (binary or multi-class) instead of continuous. Unlike Linear Regression, which predicts a continuous value, Logistic Regression predicts the probability of an event occurring or not occurring.
In simple words:
- Linear Regression → Predicts continuous values like price, salary, temperature.
- Logistic Regression → Predicts categorical outcomes like Yes/No, Spam/Not Spam, Default/No Default.
Example:
- Will a customer buy a product? → Yes or No
- Is the email spam or not? → Spam or Not Spam
- Will a patient get diabetes? → Yes or No
The main goal of Logistic Regression is to classify data into categories (binary or multi-class) by estimating the probability of an event using a function called the Sigmoid Function (or Logistic Function).
Why Is It Called Logistic Regression?
Although it is called Logistic Regression, it is technically a classification algorithm. The term regression comes from the fact that it uses a regression approach to predict probabilities, but then applies a threshold to classify the outcomes.
For example:
- If probability ≥ 0.5 → Class 1 (Yes/Positive)
- If probability < 0.5 → Class 0 (No/Negative)
Mathematical Equation of Logistic Regression
The mathematical representation of Logistic Regression is:

Understanding the Sigmoid Function (S-Curve)
The core concept of Logistic Regression is based on the Sigmoid Function, which looks like an S-shaped curve (hence the name S-Curve). This function:
- Converts the output into a probability value between 0 and 1.
- If the probability is ≥ 0.5, it predicts Class 1 (Yes).
- If the probability is < 0.5, it predicts Class 0 (No).
Graphically, the Sigmoid Function looks like this:
- X-axis: Input values
- Y-axis: Probability (0 to 1)
- Middle Point (0.5): Decision boundary for classification
Example of Logistic Regression in Real Life
Example 1: Spam Email Detection
Suppose you have an email and you want to predict whether it is Spam or Not Spam.
- Input: Email text, Subject line, Sender name.
- Output: Spam (1) or Not Spam (0).
- Probability:
- If p≥0.5p \geq 0.5 → Predict Spam.
- If p<0.5p < 0.5 → Predict Not Spam.
Example 2: Loan Default Prediction
A bank wants to predict whether a customer will default on a loan or not.
- Input: Credit score, Income, Loan amount, Age, etc.
- Output: Default (Yes) or No Default (No).
- The Logistic Regression will calculate the probability of default and classify the customer.
Example 3: Disease Prediction
A hospital wants to predict whether a patient has diabetes or not based on their health parameters.
- Input: Age, Blood Pressure, Sugar Level, BMI, etc.
- Output: Has Diabetes (Yes) or No Diabetes (No).
- Probability:
- If p≥0.5p \geq 0.5 → Predict Diabetes.
- If p<0.5p < 0.5 → Predict No Diabetes.
Graphical Representation of Logistic Regression

In Logistic Regression, the output is not a straight line like Linear Regression. Instead, it uses an S-shaped curve (Sigmoid Function) to classify the outputs. The curve separates the two classes (0 and 1) based on the probability.
- X-axis: Independent Variable (like Age, Income)
- Y-axis: Probability (0 to 1)
- Decision Boundary: Threshold (0.5)

Key Characteristics of Logistic Regression

Why Can’t We Use Linear Regression for Classification?
A common question beginners ask is:
“Why can’t we use Linear Regression for classification?”
Here’s why:
- Linear Regression predicts continuous values without boundaries.
- If you use Linear Regression for classification, the predicted values may go beyond 0 and 1 (like -10 or +25), which is not a valid probability.
- Logistic Regression restricts the output between 0 and 1 using the Sigmoid Function, making it suitable for classification problems.
Limitations of Logistic Regression
Although Logistic Regression is powerful, it has some limitations:
- Assumes a linear relationship between input and output variables.
- Struggles with non-linear data unless transformed.
- Can’t handle complex relationships without feature engineering.
Also Read: A Beginner’s Guide to Supervised and Unsupervised Learning in Machine Learning
Key Differences Between Linear and Logistic Regression

When to Use Linear Regression and When to Use Logistic Regression?
Understanding when to use Linear Regression and when to use Logistic Regression is crucial in machine learning model selection. Using the wrong model can lead to inaccurate predictions and misleading results. Here's a clear guideline on when to use each regression model.
When to Use Linear Regression?
You should use Linear Regression when:
1. Your Target Output Is Continuous
If your dependent variable (Y) is continuous, meaning it can take any numerical value like:
- House Prices → ₹2,50,000, ₹3,00,000, ₹5,50,000
- Sales Revenue → $10,000, $50,000, $1,00,000
- Temperature → 20°C, 30°C, 35°C
Example: Predicting the stock price or house price based on historical data.
2. You Want to Identify Trends or Relationships
If your goal is to understand the relationship between two variables, Linear Regression is ideal.
Example:
- Higher Advertisement Spending → Higher Sales Revenue
- More Experience → Higher Salary
3. You Want to Predict Future Values
If you want to make future predictions like:
- What will be the revenue next month?
- How much will the house price be in the next 6 months?
- What will be the average temperature next year?
Linear Regression is best for: Forecasting revenue, predicting housing prices, predicting stock market trends, etc.
4. You Have Linear Relationships
If there is a linear relationship between input and output, Linear Regression will fit perfectly.
Example:
- More Study Hours → Higher Marks
- More Marketing Budget → Higher Sales
When to Avoid Linear Regression?
Avoid Linear Regression if:
- You are dealing with classification problems (Yes/No, Spam/Not Spam).
- Your output variable is categorical.
- There is no linear relationship between input and output.
When to Use Logistic Regression?
You should use Logistic Regression when:
1. Your Target Output Is Categorical
If your output variable (target) belongs to specific categories, Logistic Regression is the best choice.
Examples of Binary Classification (Yes/No, 0/1):
- Spam or Not Spam → Email Classification
- Default or No Default → Loan Default Prediction
- Has Diabetes or No Diabetes → Disease Prediction
- Click or No Click → Ad Click Prediction
In all these cases, the output is either Yes/No or 0/1, which makes Logistic Regression the best choice.
2. You Want to Predict Probability of an Event
Logistic Regression is ideal when you want to predict the likelihood (probability) of an event happening.
Examples:
- Probability of Defaulting a Loan → 0.8 (80%) chance of default
- Probability of Getting Diabetes → 0.6 (60%) chance of diabetes
- Probability of Customer Churn → 0.4 (40%) chance of churn
Logistic Regression converts probabilities into binary outputs (Yes/No) based on a threshold (usually 0.5).
3. You Have Binary or Multi-Class Problems
Logistic Regression can handle:
- Binary Classification (Yes/No)
- Multi-class Classification (Cat/Dog/Bird)
If you want to classify emails, customers, diseases, defaults, frauds, etc., Logistic Regression is ideal.
4. You Need a Decision Boundary
Logistic Regression automatically creates a decision boundary based on probability (0.5 by default).
Example:
- Probability ≥ 0.5 → Class 1 (Spam, Default, Positive)
- Probability < 0.5 → Class 0 (Not Spam, No Default, Negative)
When to Avoid Logistic Regression?
Avoid Logistic Regression if:
1. You need to predict continuous values like prices, revenue, temperature, etc.
2. The relationship is purely linear (use Linear Regression instead).
3. The data is not suitable for binary or multi-class classification.
Golden Rule to Remember

Also Read: 10 Essential Python Libraries for Machine Learning: A Must-Have Toolkit
Conclusion
In this article, we explored the key differences between Linear Regression and Logistic Regression in depth. Understanding the key differences in linear vs logistic regression is crucial to selecting the right model for prediction or classification tasks in machine learning. Linear Logistic Regression is often misunderstood, but it simply refers to using Linear Regression for continuous data and Logistic Regression for classification tasks.
While Linear Regression is widely used for predicting continuous values such as house prices, sales revenue, or stock prices, Logistic Regression is best suited for classification problems like spam detection, loan default prediction, or disease diagnosis.
The primary difference lies in their output type and mathematical approach:
- Linear Regression predicts continuous values based on a linear equation, making it ideal for forecasting and trend prediction.
- Logistic Regression predicts probability values and uses a decision boundary to classify the output, making it ideal for binary or multi-class classification problems.
- If your output is a number (like revenue, temperature, price) → Use Linear Regression.
- If your output is Yes/No, 0/1, Spam/Not Spam → Use Logistic Regression.
- If you are predicting the probability of an event occurring → Use Logistic Regression.
- If you are establishing a linear relationship → Use Linear Regression.
For any business use case, understanding whether you are solving a regression problem (predicting continuous values) or a classification problem (predicting categories) is the key to selecting the right model.


.jpeg)


.avif)

Lorem ipsum dolor sit amet, consectetur adipiscing elit. Suspendisse varius enim in eros elementum tristique. Duis cursus, mi quis viverra.